X
Subscribe!
Get the latest updates on SmartMan!
Subscribe!
Get the latest updates on SmartMan!
* Objective Verifiable Benchmarks
* Establish Realistic Thresholds of Performance
* Chart Retention Levels
* Identify Areas Needing Improvement
* Graph Numbers and Performance Levels
* Show Maintenance of Standards
* Graph Trends Over Time
* Objective Analysis to Feed into ROI
201 Level Products include all QCI basic (see further below, as well as an extra group of tools for trainer. These make accessing assembling, and displaying your data easier and faster.
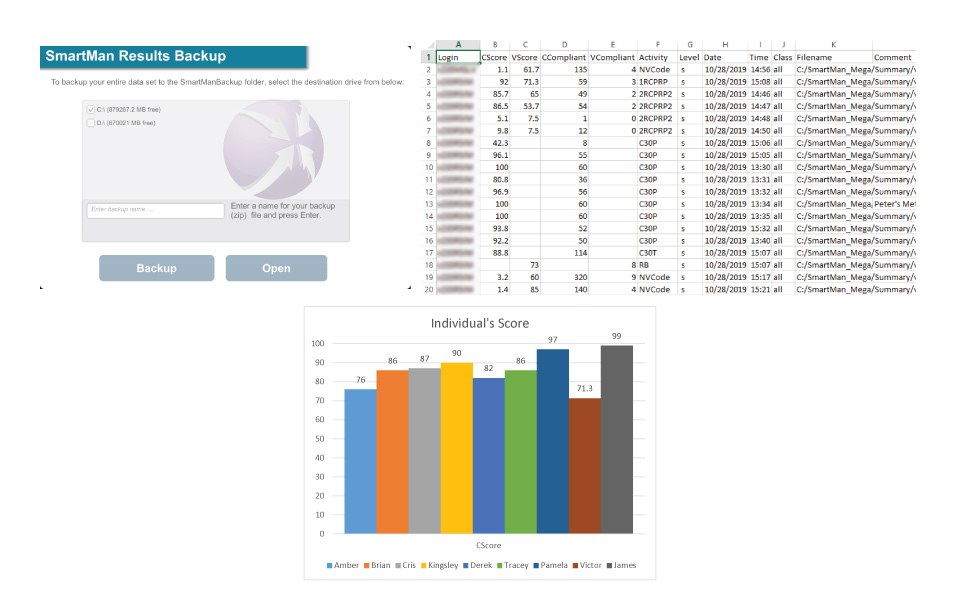
For example it makes backing up to an external stick a single click. Being able to export the information to a spreadsheet means it is easy to display your selected information in a graph. There is access to all data and with the ability to filter and then export that filtered data. From there it is possible to use programs such as Excel to create charts and display their data, and it is easier to process and analyzing the data beyond the visual displays. They are particularly useful to examine a class performance and to look at an individual's performance over time.
Backing up data should be a normal part of everyone's sessions. We have made it easy. Popup a memory stick into the slot, click on backup and give it a name. Good backups of your data prevent pain later.
You can filter by activity performed and date. Then sort within that sub-set of data. Once you have the data you want you can export it to Excel for further processing.
One button click to export your data to a spreadsheet. Exporting is crucial so that you have a master database for statistical analysis and easy to create graphs of sub-group performances.
* Immediate Access
* Immediate Summary Graphs
* Single Click to View Analysis
* View Results At Anytime
* Backup and Export
* Single Click to Display
* View Now or at a Later Time
* Analysis of Performance Charts
* Display on Large Screen
SmartMan ALWAYS gives you ACCURATE data. Our proprietary sensors have the highest fidelity data streams in emergency response. If you do not have reliable data, you cannot make informed decisions. QCI (Quality Control Information) module is the module included in all SmartMan products that allows you to access the data produced when an activity is performed. It provides visual display of information, allows you to backup your data and to export the information to an Excel spreadsheet.
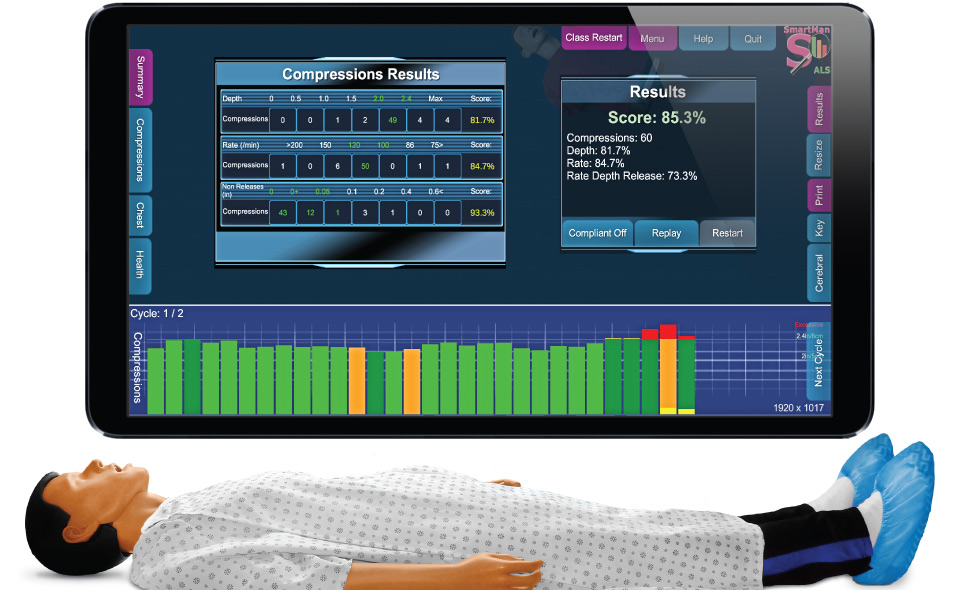
All SmartMan produce accurate data. The colored graphs are constructed from data. When you see results, you can press on the various tabs to see summaries of the performance data and more detailed graphs. All products also provide you the ability to review any results at a later so that you have immediate access to that visual display of data.
As soon as any activity is completed the score and summary of the performance appear in the Results window. Click on a button to see performance data of compressions and ventilations displayed in tables. Click on the Summary Button for an overall view of the skills performance.
When viewing results, click on one of the tabs to view a table of the performance skills. For example, for chest compressions you will see a table showing the data for depth, rate and release for that performance.
You can examine the results from any activity at any time. When you review results you see the full visual display in SmartMan which is the same as when the activity was just completed. This is great for highlighting specific performance issues. Also you can replay the on screen display.
SmartMan offers classes on how to use the data which you are producing.>>> More on Data Courses.
You may be interested in having SmartMan gather and put together data from different sites. Our eSERT Program integrates with the cloud and offers time saving features and a custom created dashboard for you.>>> More on eSERT.